6.3 Representation of Thermodynamic Processes in
 coordinates
It is often useful to plot the thermodynamic state transitions and
the cycles in terms of temperature (or enthalpy) and entropy,  ,
,
 , rather than
  ,
,  . The maximum temperature is often the
constraint on the process and the enthalpy changes show the work
done or heat received directly, so that plotting in terms of these
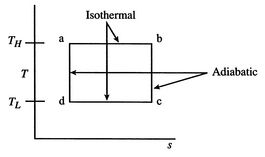
variables provides insight into the process. A Carnot cycle is shown
below in these coordinates, in which it is a rectangle, with two
horizontal, constant temperature legs. The other two legs are
reversible and adiabatic, hence isentropic (
. The maximum temperature is often the
constraint on the process and the enthalpy changes show the work
done or heat received directly, so that plotting in terms of these
variables provides insight into the process. A Carnot cycle is shown
below in these coordinates, in which it is a rectangle, with two
horizontal, constant temperature legs. The other two legs are
reversible and adiabatic, hence isentropic (
 ), and therefore vertical in
-
), and therefore vertical in
- coordinates.
Figure 6.3:
Carnot cycle in
-
coordinates
|
|
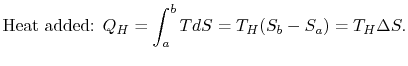
If the cycle is traversed clockwise, the heat added is
The heat rejected (from  to
to  ) has magnitude
 .
.
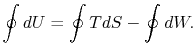
The work done by the cycle can be found using the first law for a
reversible process:
We can integrate this last expression around the closed path traced
out by the cycle:
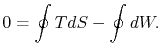
However  is an exact differential and its integral around a
closed contour is zero:
is an exact differential and its integral around a
closed contour is zero:
The work done by the cycle,
which is represented by the term  , is equal to
  , the area enclosed by the closed contour in the
-
plane.
This area represents the difference between the heat absorbed (
, the area enclosed by the closed contour in the
-
plane.
This area represents the difference between the heat absorbed ( at the high temperature) and the heat rejected (
at
the low temperature). Finding the work done through evaluation of
is an alternative to computation of the work in a
reversible cycle from
at the high temperature) and the heat rejected (
at
the low temperature). Finding the work done through evaluation of
is an alternative to computation of the work in a
reversible cycle from  . Finally, although we have carried
out the discussion in terms of the entropy,
, all of the
arguments carry over to the specific entropy,
; the work of the
reversible cycle per unit mass is given by
. Finally, although we have carried
out the discussion in terms of the entropy,
, all of the
arguments carry over to the specific entropy,
; the work of the
reversible cycle per unit mass is given by  .
.
Muddy Points
How does one interpret  -
diagrams?
(MP 6.3)
-
diagrams?
(MP 6.3)
Is it always OK to ``switch''
-
and
-
diagram?
(MP 6.4)
What is the best way to become comfortable with
-
diagrams?
(MP 6.5)
What is a reversible adiabat physically?
(MP 6.6)
UnifiedTP
|